Monday, July 26, 2021

Musings on realignment

                                
                              The Apocalypse

Texas and Oklahoma's impending move to the SEC will set off a chain of effects in college sports. Most of which I think will be very bad. These are a few thoughts I have on the impacts it will have on college baseball and football scheduling. Neither of these topics are getting much attention from the national media.

Baseball

This will further consolidate power in the SEC and strengthen even more the league's status as the best league in college baseball. Earlier this month, I tried to quantify the strongest programs in college baseball by using a formula where national champions earn 16 points in a year, runner-ups 8, CWS participants 4, regional winners 2, and regional participants 1. Since LSU's title in 2009, 7 of the top 12 programs are/will be SEC members.


It'll be the SEC and everyone else. Needless to say it isn't good for competitive balance in the sport. The biggest losers in this will be new money programs like TCU and Texas Tech which have risen to power in the 21st century. Even if they join a power league like the PAC-1x, it will be difficult to get top in-state talents to play in front of 150 people in Los Angeles and Berkeley over thousands in true college baseball towns on an ESPN platform. Same goes for Oklahoma State. This will also make things difficult for other non-SEC premier programs that share states with SEC programs (FSU and Miami in Florida, Clemson in South Carolina, etc.). But for TCU, Texas Tech, Baylor, and Oklahoma State in particular, it seems unlikely that these programs will be able to recruit a similar caliber roster that they have in the past. That's bad for college baseball. 

Another concern is a potential 36-game league schedule for the SEC in baseball. This would chop off two weekends of non-con. Granted, this is far from a given, and the ACC going to a temporary 36-game schedule in 2021 and tanking their RPIs in the process may scare the SEC from doing so. Still, something to keep an eye on.

Football Scheduling

The G5 should be sounding the alarm bells as reports of 9 and 10-game SEC conference schedules have surfaced. The SEC is one of two power conferences that still plays 4 non-con games (along with the ACC). However, it seems certain one of these games will be cut with the potential of two games being cut. This means fewer guarantee games and revenue sources for group of 5 and FCS programs. Additionally, more and more power schools have loaded up on P5 games in the late 2020s. Alabama, Florida, and Georgia all have at least 2 power non-con games scheduled from 2025-2032. With a 2 or 3-game non-con slate, that leaves room for only 1 or possibly 0 games against G5 and FCS. This is potentially disastrous for schools at the lower levels. Kent State, for example, made almost 13% of their athletic revenue in FY19 off of buy games at big schools. It would be difficult for that athletic department to survive without these games. Not only from a budgetary standpoint, but the elimination of buy games isn't good from a competitive standpoint. Players at schools like Southern Miss should be able to play at a venue like Bryant-Denny or Tiger Stadium during their career. It's a great experience for the athletes and playing at an Alabama or LSU is used as a pitch during recruiting. Aside from fewer buy games, it also takes away quirky road games for SEC teams. Under a 9-game or 10-game league schedule, games like Oklahoma at Tulane, Arkansas at Memphis, and Mississippi State at Southern Miss are less likely to happen. That isn't fun or good for the sport in my opinion. Closing off the G5 and FCS in schedule will just quicken the transition to a power-only superleague. Bad!

Tuesday, June 1, 2021

Tweaking the selection process for the NCAA baseball tournament

This will be some very informal writing on how to fix the selection process for the field of 64. After watching the recent selection announcement and the disparity in outcomes (*cough cough* Starkville), I've brainstormed and came up with a few ideas to improve equity in the process. Here are the four things I came up with:

1) Committee - the committee needs to be realigned and term limits should be cut in half from 4 years to 2 years. It should consist of five people from the power 5 and then five from the non-power 5 for a total of 10 people. The non-power 5 spots should be divided into five pools based on conference and rotated between those conferences every 2 years. My proposed pools are listed below:

Pool A - C-USA, AAC, Sun Belt, MVC

Pool B - WCC, Big West, MWC, WAC

Pool C - Southland, A-Sun, SoCon, Big East, CAA

Pool D - OVC, America East, Big South, A10, Horizon, MAC

Pool E - Summit, Patriot, NEC, SWAC, MEAC, Ivy, MAAC

These pools balance geography (the west is guaranteed 2 spots) and competitiveness with the top non power conferences being rotated more often than the bottom non power conferences.

2) Video - this should be fairly straightforward. The committee needs to have their meetings streamed and available for viewing much like a government entity. This will Hold Them Accountable™ and prevent any deal making where committee members get their school a favorable draw because of their position.

3) New selection metric - the RPI is an antiquated way to measure teams. The committee needs to adopt a more modern metric where margin of victory is taken into account. The basketball process was modernized a few years ago when the RPI was gotten rid of to make way for the efficiency-based NET. A rating system comparable to the Massey rankings would be a much more ideal and accurate way to determine how good a team is.

4) S-Curve - the field needs to be seeded 1-64 like the basketball tournament is seeded 1-68. The #1 overall seed should get the #32 overall seed (the weakest #2 seed). The #16 overall seed should get the #17 overall seed (the strongest #2 seed). And so on. The bracket should be based on competitiveness and not geography. The strongest #4 seed Wright State shouldn't be playing a top 3 seed while the #13 overall seed ECU gets a bottom 2 team in the field because of geography. The decision to seed teams from 1-16 (changed from 1-8) that was made in the fall of 2017 was a good move but needs to be taken a step further.

Sunday, May 9, 2021

Looking at the 20 potential host sites and how USM fits in the picture

This year in college baseball the 16 host selections are getting a new twist on how they're selected. 20 sites will be announced by the committee later this week and then these will be whittled down to 16 the night before the field of 64 is selected as is tradition. In the COVID season, there are several different factors that could come into play including geography and how leagues with limited (or no) non-conference play will be evaluated. I'll take a look at the teams I think there are likely to make the 20, those on the bubble, and then examine how the non-USM teams on the bubble look.

The 20

There are 16 teams that I believe are at least probable to make the initial list revealed by the committee. These are as follows:

DEFINITELY IN (11)

Arkansas

Mississippi State

TCU

Vanderbilt

Texas

Arizona

Tennessee

Ole Miss

Texas Tech

Oregon

Notre Dame

PROBABLY IN (5)

Charlotte

East Carolina

Florida

Stanford

Pittsburgh

BUBBLE (10 for 4 spots)

South Carolina

Miami (FL)

Louisiana Tech

Southern Miss

Oregon State

UC Irvine

UCLA

Florida State

Georgia Tech

Louisville


Limited or regionalized non-conference

The burning question is how the committee will approach leagues that have no, limited, or regionalized non-conference play. Out of the 10 teams on my bubble, 4 played limited non-con (the ACC teams) and 3 played a very regionalized non-conference (Oregon State, UCI, UCLA). This has impacted the RPI of these teams which has historically been the backbone of the selection process.

In a normal year, the ACC would build up gaudy win-loss records in non-conference play which would boost the RPI of their teams. This is important because your opponents' winning % is 50% of the RPI formula. For example, if Florida State beats a 40-16 Louisville that's going to be more valuable in the RPI than if Louisville is 34-22. With limited non-conference play, ACC teams have beat up one another and brought their records and winning percentages down more than they would be in a normal year. This has hurt the ACC's RPIs across the board.

Most teams on the West Coast have played close to a full non-conference but one that is very regional in nature due to travel restrictions. UCLA didn't leave the state of California until April 23rd. UC Irvine will not play a regular season game outside of California. Oregon State did not travel east of Phoenix in the non-conference slate. While this doesn't impact the RPI as much as the ACC's decision to go from 30 to 36 conference games, it does limit the pool of possible opponents. Most years these teams would travel east (or bring in teams from other parts of the country) to boost the RPI. But that wasn't possible this season and has hurt their RPI to a degree. 

How the committee addresses these leagues and teams is perhaps the most pressing question in the 2021 selection process. If they look at the RPI like they would in a normal year, it hurts the chances of these teams and helps USM since the RPI is stronger than most on the bubble. If they write off the RPI and look more at conference records and in-person evaluations (regional advisory committees), that's going to be a positive for these teams in getting on the list of 20. 

The Louisiana Tech conundrum

How Louisiana Tech is evaluated will be of great importance to the chances of Southern Miss getting on the initial list of 20. Tech has a fairly strong resumé with a top 25 RPI and a winning record against the top 50 of RPI. But in the event they are left out, it's tough to see USM getting in. Tech has the edge in RPI, top 50 record, and head-to-head. The resumé is just objectively better and if Ruston isn't on the list, then it'd have to be assumed Hattiesburg isn't either. USM fans need to root for Tech to be on the list later this week.

South Carolina

South Carolina presents another problem. The Gamecocks have a host-worthy RPI but a .500 record in league play. It's extraordinarily rare for a .500 team in conference play to be awarded a host site (Florida State was such a case in 2017) and unprecedented for a team with a losing record in conference play to get a site. They finish with Kentucky on the road and Tennessee at home. If the committee feels they can get to 16-14 in league play, they could make the list of 20. But they'd be banking on something that is far from a given.

Geography

In the COVID era, geography could very well come into play. There are going to be 2 sites announced in the 20 in Mississippi with Mississippi State and Ole Miss plus Louisiana Tech nearby and probably ahead of USM in the committee's eyes. The NCAA could choose sites where no other probable hosts are to limit travel. This would help UCLA and UC Irvine in Southern California where the nearest host site is Arizona or Stanford. And obviously would hurt USM's chances.

Conclusion

Southern Miss' best bet to make the initial list of 20 is that the NCAA sticks with a traditional selection process where the RPI is the foundation. If exceptions are made for the ACC and West Coast teams due to wacky scheduling, they could jump USM in the pecking order. Southern Miss has a good RPI compared to many of the contenders but in a year where the RPI has produced oddball results (such as Fairfield being top 10), the committee could opt to balance with geography or select a power conference team with a good record in their league.


Thursday, December 3, 2020

In defense of the Southern Miss job

Following the announcement of Tulane offensive coordinator Will Hall being hired at Southern Miss, one of the things we've heard from opposing fans is how difficult this position is. "The pay isn't good! The facilities are bad! They have no budget!" are common lines we hear from the AAC and SEC (and even other leagues) masses. And all are true to at least some degree. But is the USM football job a uniquely bad position in the mold of a Louisiana-Monroe? I don't think so. And if ULM isn't a peer, who is?

I've compared because USM and ULM because at the surface level the two programs seem similar. Both are cash-strapped G5s outside of large urban areas in the Deep South. The Eagles and Warhawks are often called dead-end jobs by fans. But when you take a closer look at things, you see that there is nothing at all comparable about the two situations. Below I have made a spreadsheet comparing Southern Miss and ULM both athletically and institutionally. Money numbers related to athletics come from the USA TODAY's database.


USM far outpaces them in every category. Even with the head coach pay where Jay Hopson was dead last in C-USA, he still made 20%+ more than Matt Viator at ULM. And all indications are that this will see a substantial jump. AD Jeremy McCain told the Sun Herald that he wants the next salary to be in the top 5 range of the conference. Based on that, the minimum salary for Hall will likely be around $900,000 with assistant pay in the 1.3M-1.4M range. Both of these very competitive at the G5 level. Additionally, while the budget at USM is 3rd lowest in FBS, ULM's is only about 66% of that figure. Their athletic budget is on the level of a regional Southland university.

Institutionally, the universities are not peers. ULM is R3 (moderate research) with an endowment that isn't a quarter of what USM has. They have very limited doctorate degree offerings. Southern Miss is R1 (very high research). Academically, Louisiana-Monroe is closer to West Georgia where Will Hall coached in D2, than Southern Miss. Not only are the athletic programs far apart, but the universities itself are to. I'm not saying USM is Harvard, it's not, but it's still much more highly regarded than ULM. 

Lastly, Southern Miss simply has an established donor base and brand in a way Louisiana-Monroe does not. The contributions at USM were more than 5x than that of ULM in 2019 with attendance numbers about double. And while not quantifiable, Southern Miss is more a part of the cultural fabric in South Mississippi than ULM is in North Louisiana. All of this allows USM to develop a core following in a way that ULM cannot. 

So, if the Louisiana-Monroe job is uniquely hard, which G5 programs can Southern Miss compare their job to? The answer would seem to be Louisiana Tech and Georgia Southern. 

The USM situation compares favorably with both Louisiana Tech and Georgia Southern --- both successful G5 programs that don't have the "dead-end job" narrative around them. While Southern Miss trails in HC pay by a bit that's going to change soon as previously noted. The three programs are all R1/2 universities in rural areas (rural-ish in Hattiesburg's case) that have athletic budgets under $30M. All 3 also have small, but engaged fanbases and established donor pools. Georgia Southern has a larger enrollment than USM and LaTech due to them in being a major state but their endowment trails by a decent margin. While not in the spreadsheet, none of these 3 programs have an indoor practice facility, which is yet another similarity. 

Why the Southern Miss job has the narrative of being impossible or a dead-ender is anyone's guess. Louisiana Tech and Georgia Southern have seen their programs ascend whereas Southern Miss' has descended in the last decade. Jay Hopson taking a comically low salary for FBS standards of 500k didn't help either. Additionally, USM is somewhat of a Millwall within college football, as I've said before. Tulane, Memphis, and other AAC fans like to slander Southern Miss because they're bitter some guy named BowerPower69 was mean to them on a C-USA message board in like 2004. Ole Miss and Mississippi State like to slander the job because their USM co-worker at an office park in Flowood talked smack too much after a midweek baseball win during the Corky Palmer days.

In any case, the claim that the USM football job is extraordinarily difficult by G5 standards does not stand up to any scrutiny. That's not to say there aren't challenges in Hattiesburg. There are! But the resources and situation here are close (better in some metrics) than programs like Louisiana Tech and Georgia Southern which have been top teams in their league for years now. It's a winnable gig. This is not a ULM situation. The pay is competitive within the C-USA/Sun Belt level, the fan support is fine for a non-P5, and the recruiting territory is fertile even if the program doesn't have access to the players it did 10 or 20 years ago. It's not a coaching graveyard. A good coach, which I think Will Hall is, can and will win here. 

Monday, October 5, 2020

Electoral prospects for medical marijuana in Mississippi

Initiative 65 and 65A are the competing measures in Mississippi on the subject of medical marijuana.  65 is the citizen initiative while 65A is the legislative alternative. There will be two questions regarding this measure; the first question for approval of either and the second for the preference of 65 or 65A. For either initiative to be approved, the first question must win a majority (50%+1). If the first question has majority support, then the initiative with the most votes on the second question will become law. However, there is a catch. The initiative must win 40% of total ballots on the second question. In the event both 65 or 65A fail to get 40% of total ballots on the second question, then neither become law, even if the first question has a majority "EITHER" vote. I will attempt to explain the competing initiatives, both questions, and analyze whether or not 65 or 65A have a chance at being approved.

Background

65 was put on the ballot after getting the required signatures. The alternative, 65A, was put on the ballot by the legislature during the 2020 session. You can see the differences between the two initiatives in the photo below. Essentially, 65A is a more restrictive version of 65. Also, 65 has parameters already whereas 65A's specifics would be set by the legislature later.


This is the second time in recent years that an alternate measure has been added to the ballot. In 2015, Initiative 42A competed with Initiative 42 on a school funding measure. In the end, the first question of that measure failed to received a majority which made the result of the second question irrelevant.

First question

The first question is essentially an up or down vote on if you want a medical marijuana program in the state of Mississippi. The image below from Ballotpedia summarizes the two options on the first question of this measure.


So, medical marijuana supporters will choose "either measure" and opponents will choose "neither measure." Simple enough.

Analysis

The first question is likely to have majority support from the Mississippi electorate. A poll conducted in May had support for medical marijuana in Mississippi at 81%. But the way the question was worded was odd and potentially increased support in the poll. A better indicator would be the 2016 medical marijuana initiative in Arkansas. In 2016, Arkansas voters approved a medical marijuana proposal with 53% of the vote. Arkansas is not a perfect comparison for Mississippi, but both are rural states in the south that have minimal economic development. 

We'll take a look at the white vote and the black vote for Arkansas' Issue 6. Then attempt to extrapolate this to the Mississippi electorate. White voters in the Natural State aren't quite as conservative as those in Mississippi. But they are generally right-leaning and support the Republican Party. Black voters in both states vote for Democrats at roughly the same clip.


I took results from 20 heavily-white precincts across the state and tried to balance urban and rural areas. It was about a 50-50 split. Black voters went for the initiative at around a 70-30 split. I did a similar thing with these precincts by taking a smattering of precincts from around the state while balancing urban and rural in an attempt to get the most accurate demographic breakdown.

Based on this, we can expect white voters in Mississippi to vote "EITHER" on the first question at about a 45-50% rate. As previously mentioned, Mississippi whites are a little more conservative than Arkansas whites, which might keep it a little below the 50% mark. But opinion on this continues to trend in the direction of support (this initiative actually failed in 2012 in Arkansas before winning in 2016). So we'll predict it in this range for white voters. Support among African-American voters is likely to be in the 70-75% range based on the Arkansas results. "EITHER" may run a few points ahead of the 70% AA support in Arkansas because of the aforementioned shifting opinion nationally on this issue.

Now we need to extrapolate this to the Mississippi electorate. Mississippi's voting-age population is 60% white and 40% non-white (with near 100% of the majority of this population being African-American). But whites tend to be registered to vote at a higher rate and tend to turn out in elections at a higher rate. So we'll say the electorate on November is 68% white and 32% non-white. Mike Espy has said that his 2018 election was a turnout of 68/32 so this should be close or maybe even exact. When plugging in 47.5% white support and 72.5% non-white support (i.e. the middle between the two ranges given), you get "EITHER" winning 55.5% of the vote on the first question. 


If you use the ranges for both whites (45-50%) and non-whites (70-75%) it gives you a result anywhere from 53-58%. Remember that the Arkansas initiative got 53% in 2016 but Mississippi's high minority population means it has a good chance to eclipse that mark in November.

In terms of geography, we can expect counties that support Joe Biden to vote "EITHER" at a higher rate than counties that vote for Donald Trump. Support for Hillary Clinton showed a moderate positive correlation with support for medical marijuana in Arkansas. Issue 6 ran behind Clinton in only four counties in Arkansas; all of these were minority-majority. The counties where Issue 6 ran the farthest ahead of Clinton were typically heavily-white counties where Trump did extremely well. Issue 6 ran behind the statewide % in these areas but still ran 30+ points ahead of Clinton.

Based on what we saw in Arkansas, we can say that the map for the first question on Mississippi's Initiative 65 is likely to resemble the map from the 2011 Personhood amendment (AKA Life Begins at Fertilization question) but in reverse.


This amendment was defeated with "NO" getting 57%. The amendment did the poorest in majority-minority counties and urban/suburban counties. The inverse of this seems bound to happen on the medical marijuana initiative in November. "EITHER" is likely headed for majorities in the Delta and other majority-minority counties, even if it underperforms Biden's support as we saw from similar counties in Arkansas. Additionally, urban whites will back this amendment at a higher rate than rural whites. Look for "EITHER" to win majorities in urban counties that Republicans usually win. Madison, Harrison, Forrest, Lafayette, etc. As well as overperforming in a purple county like Oktibbeha or a blue county like Hinds. The first question probably won't win a majority in heavily-white Republican counties like George and Itawamba (among others) but should still run well ahead of Biden.

TL;DR on Question #1

"EITHER" is likely to get a majority of votes on the first question. Arkansas voters supported a medical marijuana initiative in 2016 at 53% and Mississippi has a more favorable electorate than the Natural State due to the large African-American population in the state. This is even considering the fact that Mississippi whites are to the right of Arkansas whites. National support for medical marijuana has also increased since 2016. 53-58% is the range that I'm predicting based on the demographic of Mississippi's electorate and the results from 2016 in Arkansas.

Counties with a large minority population are expected to back the amendment given the results in heavily-black precincts in Arkansas. Urban whites are also likely to support the amendment and Jackson, the Coast, and the college communities will give majorities for the first question of this measure. 

Second question

Remember, "EITHER" must receive a majority on the first question for this to even matter. All of this is assuming this does indeed happen.

The second question is asking which of the two competing initiatives that the voter prefers. The image below from Ballotpedia explains the second question and what voting for either option means. 


Analysis

This is where things get tricky to predict. The results of Initiative 42 in 2015 provide somewhat of a look at what to expect with the results of this measure. On the second question from I42, 42 got 47%, 42A got 33%, and 20% of ballots were left blank. The blank ballots are very significant. What happened was many of the people that voted "NEITHER" on the first question left the second question blank thinking they didn't need to fill that out because they were against both initiatives. So, 42 received a fairly strong plurality even though most people probably preferred 42A over it. This was because of the blank ballots. More on how this is important to 65/65A later.

Below is an expectancy chart of blank ballots based on the % of "NEITHER" votes on the first question. It's impossible to get the exact number of blank ballots for people who voted "NEITHER" on the first question in 2015 but 35-40% is a ballpark estimate based on the statewide, county, and precinct results. 


In the event that the first question passes, then if 20% or fewer of ballots are left blank, one of the initiatives is guaranteed to pass. This is because one of them mathematically must hit the magic 40% number required. I estimated earlier that the first question would get about 53-58% support meaning the "NEITHER" vote would be 42-47% range. Based on the chart, we would expect about 17-19% of ballots to be left blank on the second question. Which as mentioned earlier would guarantee the passage of one of the initiatives. The fewer blank ballots there are on question #2 the better the chances that one of these measures gets through. 

The question is now which of the initiatives will the voters choose. In the poll referenced earlier, 52% said they supported 65 while 23% said they supported 65A. In 2015, the vast majority of people (possibly around 90%) that voted "EITHER" on the first question backed 42 over 42A. This year, though, it's possibly that a sizable number want medical marijuana but want it tightly restricted and are for 65A. We can expect most people that vote for the first question to support 65 but to what extent? The split of this vote will determine which of the two will become law.

Below is a chart that shows what % of the "EITHER" vote is needed on the second question for 65 to get to 40% of the total vote.

Based on the range earlier (53-58%), Initiative 65 would need about 70-75% of people that voted "EITHER" on the first question to vote 65 on the second. It should be noted that in 2015 that some people marked 42 on the second question while voting "NEITHER" or leaving the first question blank. We know this because in several precincts and even counties 42 had more votes than "EITHER." Given the confusing nature of the competing measures, we can expect this to happen again to some degree, but it's impossible to pin an exact number or percentage down. Initiative 65 is likely to finish above 65A on the second question. As noted earlier, a significant chunk of people that would vote 65A on Q2 will leave it blank. If same the trends from 2015's Init42 happen with medical marijuana in 2020, then about 35-40% of "NEITHER" voters on the first question will leave the second blank. We can safely assume that voters that leave the 2nd question blank would overwhelmingly support 65A over 65. Whereas close to 100% of "EITHER" voters will vote on the 2nd question (whether that be for 65 or 65A). Precincts and counties that strongly supported "EITHER" on the school funding measure in 2015 had few blanks or undervotes compared to precincts and counties that voted heavily for "NEITHER" on the first question. TL;DR on the Question #2It's difficult to say what will happen here because of the competing measures, but 65 has to be considered the favorite over 65A. People that would vote 65A are much more likely to leave the second question compared to 65 supporters who are almost certain to vote on the second question. Most people that vote "EITHER" on the first question will support 65 over 65A but the big mystery is to what extent. If it's closer to a 50/50 split, then 65A is in excellent shape. But if 65 can get 75% of "EITHER" voters then it's probable to win. This is assuming blank ballots are in line with what they were in 2015 with Initiative 42. The fewer blank ballots on the second question increase the chances of 1) some sort of program getting approved and 2) 65A finishing ahead of 65. Obviously, the higher % of "EITHER" voters on the first question means there's a better chance that 65 finishes ahead of 65A.
Conclusion

One of these two initiatives stand a good chance of being approved. Based on the Arkansas results in 2016 and adjusting them for Mississippi's demographics, support for the first question is likely to receive the majority required. This is the hard part. Initiative 42 in 2015 received the 40% required on the second question in 2015 but "EITHER" did not win the majority needed on the first question. On the second question, thanks to quirky laws regarding alternate initiatives, 65 or 65A could become law even if up to 60% of voters do not vote for it. We can expect a sizable percentage of voters to leave the second question blank. It's hard to estimate the exact percentage of blank ballots on the 2nd question, but somewhere between 15 and 20 percent seems about right. Close to all of these will be medical marijuana opponents who would choose 65A over 65 if they had a choice. Because of this, 65A is likely to finish behind 65 on the 2nd question.

Tuesday, September 8, 2020

Grip it and rip it: a look at Scotty Walden and the 2016 East Texas Baptist Tigers

Southern Miss WR coach and co-offensive coordinator Scotty Walden was named interim head coach this week following the abrupt departure of Jay Hopson. This after a 32-21 loss to South Alabama on Thursday night. Walden is an unconventional choice as interim but one that brings a lot of upside. Just 30, he was an offensive coordinator at Sul Ross State (2012) and East Texas Baptist (2013-15) --- both in Division 3. He then was promoted to head coach at ETBU which was a position he held for a year before coming to Hattiesburg. Focusing on the 2016 season at ETBU should give us some insight on the kind of style he'll bring for the remainder of this 2020 season. I'll look at three key components of WaldenBall: his gaudy offensive numbers, the pace of play, and his willingness to take risks (i.e. going for it on 4th down and two-point attempts). I'll also use the 2015 season (when he was OC) and the 2017 season (when he had left the program) to compare to the 2016 season where he had full reigns.

Offense

When you first look at the 2016 ETBU team, the first thing that jumps are the ridiculous offensive numbers. Out of 244 D3 teams, the Tigers ranked at the top or near the top in the most basic offensive stats including points per game (#1 with 49.9 ppg) and yards per game (#2 with 564 ypg). They fall a bit in tempo-adjusted stats like yards per play with 6.30 ypp (#28 overall). However, this is still well above average. 

There was a disparity in offensive success when ETBU played teams with a winning record and when they played teams with a losing record. The four lowest YPP games were against the four teams they faced with a winning record. A game against NAIA SW Assemblies of God allowed ETBU to pad stats en route to an 85-23 shellacking. They also hung 70+ against 0-10 Howard Payne.


As shown in the chart below, ETBU managed about 26 points per game against teams with winning records. Their yards per play were at just a meager 4.63. Out of this group of 4 teams includes national champion Mary Hardin-Baylor and #11 Hardin-Simmons. The only game that ETBU won against a team with a winning record was a 33-23 contest against Southwestern University. 


But against teams with a losing record they were almost unstoppable. They went 6-0 racking up 66 points a game while averaging 7+ yards per play. While they sputtered some against quality teams, they ran roughshod over the bad teams on their schedule. 

As a whole, ETBU's offensive stats from 2016 are a bit deceiving. They rank at or near the top of the heap in D3 in total offense and in scoring. But this is because they padded their numbers against some very weak teams including a game against a team from the NAIA. When playing the top competition in their league, the offense wasn't nearly as effective.

Pace of Play

ETBU in 2016 played extraordinarily fast. They averaged 89.6 plays per game ranking second in the country behind only Iowa's Central College. This is made all the more impressive by the fact that they averaged less than 27 minutes of time of possession per game (near the bottom nationally). In terms of tempo, they ran a play about every 18 seconds. This was #1 in the country. For comparison, USM ran a play about every 27 seconds against South Alabama.

The chart below shows how many played you'd expect a Walden/ETBU offense to run based on the time of possession. And then it is compared with how many plays you'd expect USM to run based on the tempo against South Alabama. 


So with an even split in time of possession (30:00), 2016 ETBU under Walden would be expected to run about 101 plays. Keep in mind that no FBS team has even come close to this number. Marshall holds the record at just under 93 plays per game in 2012. In terms of plays per minute, ETBU averaged a whopping 3.36. Again, this is another unprecedented tempo statistic. No FBS team has ever matched this number. Houston in 2012 came closest at 3.31 plays per minute. A Walden offense with 26 minutes of time of possession would still be expected to run about 11 more plays a game than USM with 34 minutes running the pace they did against South Alabama.

In 2015, when Walden was the OC, ETBU averaged 72 plays per game and ran a play just over every 21 seconds. When given the full reigns, he took things to the next level with tempo. The year after he left ETBU averaged about 80 plays a game and ran a play just under every 20 seconds. A decrease from 2016 but still above what they averaged in 2015 with Walden as OC.

Risks

Walden tried 2-point conversions and went for it on 4th down regularly in 2016 at ETBU. The Tigers scored 71 touchdowns and they went for two 35 times. That's nearly half of touchdowns where they opted not to kick it. The chart below shows when ETBU tended to go for 2 and when they didn't based on the margin at the time.


In 36 of the PAT tries, 19 were when ETBU led by 17 or more (a Tiger blowout). Kicking the extra point instead of going for 2 is the logical move so it doesn't look like you're trying to run up the score. The other 17 were in close or competitive game situations. Most of the time these 2-point tries came early in the game in relatively low-leverage situations. If the game was close and it was late, ETBU generally kicked the extra point, unless it made strategic sense to go for 2 (for example, they did go for the two-pointer in the 4th against Louisiana College where a successful try would have it made it a 3-possession game). ETBU scored 6 touchdowns when losing by more 17 or more and they went for two in all of these instances. Compared to the previous year, ETBU just went for two 4 times out of 56 touchdowns. The next year when Walden left ETBU did not attempt a single 2-point conversion.

Walden was also aggressive in going for it on 4th down. ETBU went for it on 4th down a total of 38 times in 2016 (nearly 4 times a game). That's out of 90 fourth down decisions meaning they went for it 42% of the time. The charts below breaks down the situations when ETBU went for it including distance, margin, time, and field position.

Distance


Margin


Time


Field Position


What stands out? Walden and ETBU were very likely to go for it when the distance to make was 5 yards or less. When they were put in this position, they went for it 28 of 38 times (74%). When it was 6 yards or more, they went for it 10 of 41 times (24%). Still a high number given the situation. ETBU was also likely to go for it when the outcome was pretty much decided. In situations where they were up or down 17+, they went for it 17 of 26 times (65%). When the game was within 17 points (i.e. competitive) this number dropped to 33%. In terms of time, none of the quarters really dominate. ETBU went for it 21 times in the first half compared to 17 in the second half. A handful of these second half attempts were in blowout games. And lastly we have field position. Out of their 37 4th down attempts, 23 were between their opponents' 26-50, which is no man's land for a D3 team with a bad kicker. The attempts between their own 26-50 were generally closer to midfield than the 25. They went for it once at their own 10 on 4th and 1 which was the lone attempt inside their own 25.

The year prior with Walden as OC they just went for it on fourth 17 times. In 2017, with Walden out of the picture entirely, ETBU also went for it 17 times. Significant drops from 2016.

In short, ETBU went for it a bunch, but weren't completely reckless with it. In low-leverage moments, they were more aggressive with it. In high-leverage moments (close and/or late), they tamped it down some. Most attempts were on the opponents' side of the field and they only tried going for it deep in their own territory once when they just needed a yard. They were more likely to go for it in blowouts when the outcome wasn't in doubt. When the game was closer, they played it more conservatively, but were still far more aggressive than the average football team. Shorter distance to make, as expected, led to more attempts. A gain to make of 6 yards or more led to fewer 4th down attempts.

Conclusion

ETBU and Scotty Walden played a unique style in football characterized by lots of offense, high tempo, and taking risks. Whether or not the things he tried at ETBU makes its way to Hattiesburg in 2020 remains to be seen. Given that there's essentially nothing to lose at this point, it would make sense to incorporate some of these ideas for the remaining 11 games. What we will be watching is whether or not he goes full 2016 ETBU, compromises a bit, or keeps the same approach as game #1. While this super aggressive approach of tempo and risks could potentially backfire, it should at least make things very entertaining as USM could well be the college football version of 1990 Loyola Marymount in basketball. 

Sunday, June 14, 2020

How the 2001 flag referendum predicted Mississippi politics in the 21st century

Update: I've updated this with 2020 presidential data. I've also since obtained Oktibbeha County 2000 results and that's reflected in my spreadsheets. Note rounding ---- there may be a few counties/precincts that are 0.01 off. - Patrick, 5/8/2023

In 2001, Mississippi voters went to the polls to decide whether to keep the current flag bearing the Confederate emblem or choose a new flag that didn't. The old flag won in a landslide taking a total of 64%. While the results largely matched the presidential results (i.e. old flag supporters for Bush, new flag supporters for Gore), there were a number of crossover voters. In this write-up, I will discuss 1) who the Gore/old flag voters were and their characteristics, 2) who the Bush/new flag voters were and their characteristics, and 3) how the results from the 2001 flag referendum predicted future coalitions in Mississippi politics.

2001 new flag support vs. 2000 Gore support


Gore/Confederate flag voters

County analysis

In 2000, Democratic nominee Al Gore won 40.7% of the vote in Mississippi. Black voters made up the bulk of Gore's support in the state as has been the case in the state since the civil rights era in the 1960s. Based on county results, we know that the vast majority of his voters also supported the new flag. But Gore did get 17% of the white vote, much of which came from Northeast Mississippi, also known as "Hill Country." Hill Country was the best part of the state for the old flag in the 2001 referendum. While NE Mississippi voted mostly for the Republicans at the presidential level, the area still had a number of ancestral Democrats that were loyal to the party and voted for Gore. Gore carried at least 29% of the vote in each of the core Hill Country counties. 


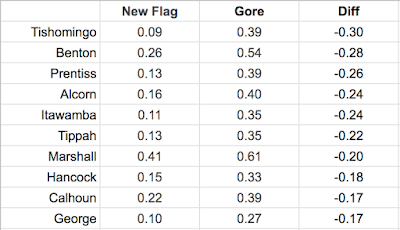
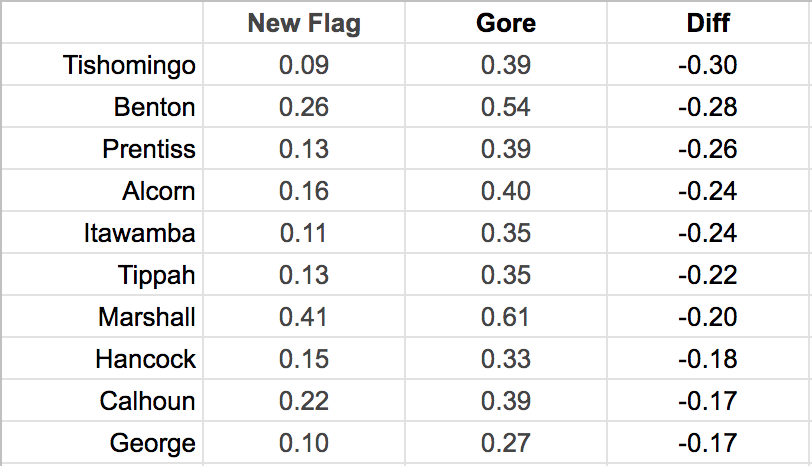
Out of the top 10 counties in negative value between the new flag and Gore, 7 were core NE Mississippi counties. 1 was another county in North Mississippi and 2 were in South Mississippi. Tishomingo County, the whitest county in the state in 2000 (95%), had the lowest vote for the new flag at just 9%. But it was far from George Bush's best county in the state. Out of 82 counties, Tishomingo ranked 40th in Bush % and was only a little over a point more Republican than the state as a whole. A large number of people in Tishomingo County and other parts of NE Mississippi were ancestral Democrats that voted Gore but also strongly supported keeping the state flag. Additionally, other rural counties throughout the state (such as Hancock and George) had voters who voted Gore in 2000 and to keep the flag in 2001.

Precinct analysis

The Mississippi SOS site and the Internet Archive make it possible to drill this information down to the precinct level in a county. While a few key counties are missing (including Tishomingo), most of the information needed is there. In this chart, I've selected a total of 14 precincts in the state; two from each of the 7 counties in the top 10 where results are available. 


The precinct results make this more clear. While Gore did not win any of these precincts, he won at least a quarter of the vote in all of them and over 40% in a handful. In Alcorn County's Bethel community, there were 90 votes cast in both the 2000 general election and 2001 flag referendum. Gore received 33 votes in the 2000 election there while the new flag did not receive one vote in the 2001 referendum. In the Bayou Phillip community of Hancock County, Gore had 36 votes out of 96 cast in 2000, while the new flag had 0 out of 107 in 2001. 

Those that supported Gore and the old flag can be characterized as rural, white, without a college degree, and generally low-income. Most stayed loyal to the Democratic Party out of tradition despite being conservative on cultural issues such as the state flag. These voters were most present in Northeast Mississippi, but other parts of Mississippi showed this pattern as well. 

Bush/new flag voters

County analysis

Republican nominee George W. Bush carried Mississippi with 57.6% of the vote. He won 81% of the white vote which made up nearly all of his support in the state. Based on county results, most Bush voters supported the old flag, but there were some that did not. As seen below, many of these were voters located in Metro Jackson or in college towns.


Suburban Madison County north of Jackson had the biggest positive difference from Gore support to the new flag. Bush carried the county with 64% of the vote but the new flag also won there. Oktibbeha County (Starkville) saw a 12 point positive difference in Gore support ----> new flag support. Other counties with that were top 5 in Gore support ->>> new flag support included Hinds (Jackson), Rankin (suburban Jackson), and Lafayette (Oxford). 

Precinct analysis

Precinct results from these counties tell us where exactly these Bush/new flag voters were. I have included Ralph Nader votes in the Gore column in precincts where he won more than 2%. These precincts are marked with an asterisk. I've also included the Thames precinct here which is a white-collar professional area of Hattiesburg. Forrest County was not a Bush ---> new flag county but Thames was a precinct where this trend was visible. 


In Northeast Jackson, the new flag beat the old flag by double-digits in several precincts where Al Gore received less than 20%. Most of these voters were less conservative than the voters in precincts where Gore got a large chunk and the old flag won giant majorities. But there isn't as much of an ancestral Democratic tradition in places like Jackson than there is in places like in Iuka or Fulton. While Jimmy Carter won back NE Mississippi for the Democrats for the first time since 1960, he lost handily in Metro Jackson. His two worst counties in the state were Rankin and Hinds. Places like NE Jackson and SW Hattiesburg have historically been conservative but more moderate on cultural issues than most of the state. These were rare pockets of the state where Richard Nixon won a plurality in 1968. George Wallace won the rest of the state's white vote overwhelmingly. Precincts like those in NE Jackson and Thames in Hattiesburg (which was part of the Pinecrest precinct in the 1968 precinct photo linked) were parts of the state where the new flag ran well ahead of Gore.

The new flag ran also significantly ahead of Gore in suburban precincts and college precincts. Highland Colony in Madison voted for the new flag with a 3/5 majority despite giving Gore less than a quarter of the vote in 2000. The new flag also won majorities in Oxford and Starkville precincts where Gore lost. In Rankin County, the new flag lost decidedly but still ran 15+ points ahead of Gore in a few areas of the county. 

Those that supported George Bush in 2000 and voted for the new flag in 2001 were mostly white, urban or suburban, higher-income, and often college-educated. These voters overwhelmingly supported Republican candidates at the presidential and state levels at the turn of the century despite being more moderate on social and cultural issues. 

What it tells us about Mississippi's voting patterns today

The flag referendum in 2001 ended up predicting future coalitions in Mississippi politics - at the presidential and state level. Socially conservative white voters in rural Mississippi that voted Democratic in the past either a) died or b) became Republican voters as the Democratic Party became increasingly associated with cultural liberalism. Urban white areas that voted Republican but were more socially moderate have became more willing to vote for Democratic candidates. This is due to a) many of the older voters in these precincts dying and being replaced by younger, liberal voters and b) voters in these precincts being turned off by Trump and thus voting for Democrats. 

For decades in Mississippi, urban whites were more loyal to the Republican Party than rural whites despite being more moderate on cultural issues. Urban whites, typically being wealthier than rural whites, gravitated toward the Republican Party which has traditionally supported conservative fiscal policies such as low taxes on the upper-middle class. 

Places today such as Fondren and Belhaven in Jackson are associated with being rare slices of white liberalism in Mississippi. But less than 20 years ago, Democrats would do worse there than they would in many rural white areas in NE Mississippi - this was true at the presidential and statewide level. 

Presidential election analysis

Let's look at the 2000 and 2020 presidential election results in Mississippi. First, I'll look at 1) counties with the most Gore/old flag supporters and 2) precincts with a significant number of Gore/old flag supporters. I'll use the same precincts I did earlier except for the ones that I think have changed boundaries since 2000.


A big decrease in support for Democrats. Biden ran at least 10 points behind Gore in all 10 counties. Blacks make up a sizable percentage of the population in Calhoun and Marshall (Marshall is narrowly majority-minority) which give Democrats a solid base there --- minimizing a Tishomingo or Itawamba-level swing. Tishomingo County, which was just 1 point more Republican than the state in 2000, was 29 points more Republican than the state in 2020. It was a top 3 county for Trump while just being 40th for Bush in 2000. Itawamba and George, also on this list, were the other two counties in the top 3 for Trump. 

Now here's the results at the precinct level.


Again, a shift away from the Democrats in all 11 precincts, often by quite a bit. In Alcorn County's Bethel community, Al Gore got 37% in 2000. Joe Biden got 2 votes out of 86 cast in 2020. Gore received over 40% in Itawamba County's Ryan community and Hancock County's Dedeaux community. But Biden was under 10% in both in 2020. 

Next up are the 2000 and 2020 presidential results from counties where there was the largest % of Bush and new flag supporters. Then we'll take a look at the precinct-level results. 


Hinds is the biggest mover here though much of this is demographic change and white flight. But some of it can attributed to more white voters in Jackson voting for the Democrats. Lafayette is the only county where Biden didn't gain a ton on Gore, though if Oxford has moved slightly away from Republicans, it's been offset by the rural precincts shifting away from Democrats. Rural Lafayette County is similar to parts of NE Mississippi where Gore won a sizable percent of the vote but where the old flag was heavily favored by voters. Madison and Rankin are a little less white than they were in 2000 (Madison 60% '00 --> 55% in 2019; Rankin 81% in 2000 --> 73% in 2019) which can at least somewhat explain the small shift toward the Democrats. Oktibbeha voted for Bush in 2000 but has now voted in four consecutive elections for Democratic presidential candidates. 

Here are the precinct-level results. I merged the East and West Reservoir precincts and the East and West Crossgates precincts. Presumably, these precincts were split since 2000. Again, Nader results included with Gore in precincts where he broke 2%. These are marked with an asterisk.


Jackson's 14th precinct (Fondren) gave Biden the biggest increase from Gore. This is an area of Jackson that's seen much gentrification in the last two decades and has become linked to white Mississippi hipsterdom. Jackson's 32nd precinct, the wealthy Eastover neighborhood, also had a big jump from Gore to Biden. Biden ran 19 points ahead of Gore here. Jackson #8 and #9 (Millsaps/Belhaven) have also moved toward the Democrats at the presidential level in the 21st century. The precinct outside of the metro area on this sheet with the largest increase in Dem % was Thames Elementary in Hattiesburg.

Statewide election analysis

Next, we'll take a look at statewide elections. First, with the Gore/old flag counties and precincts, we'll examine the 2003 attorney general race and compare it to the 2019 gubernatorial race. Then, with the Bush/new flag counties and precincts, we'll compare the 2003 and 2019 gubernatorial races.


Jim Hood was first elected to the attorney general's office in 2003. Blacks and rural whites were the base of his broad coalition and he won easily with 63% of the vote. But this coalition slowly began to break down over the next dozen years in his AG runs before completely collapsing in the 2019 gubernatorial election. By 2011, he was still winning by 20+ point margins, but his rural performance was beginning to worsen. He lost Hancock County in 2011 and was declining in NE Mississippi (though still sweeping the region with majorities). In 2015, he lost Tishomingo County, the most ancestral of the ancestral Democratic counties in NE Mississippi and barely won majorities in other counties in the region. He lost George County by nearly 30 points. In 2019 when he ran for governor, the dam burst. He lost by gigantic margins in NE Mississippi and in places like George and Hancock counties. The rural, culturally conservative white voters that long had been a key piece of his coalition had finally ditched the Democratic Party for good. When he first entered state politics, he was very popular among white voters without a degree. By 2019, they overwhelmingly rejected him.

Here's the precinct-level results from 2003 and 2019: 


A giant decrease in Hood support from 2003 to 2019. He won all of these by at least double-digits in 2003 and lost all by 20 or more in 2019. He failed to get a quarter of the vote in most. While attorney general is a downballot race, Hood still won by 25+ points in 2003 while the Republican candidate for governor won by 7 points and the Republican candidate for lieutenant governor won by 24 points. 

Next up are the Bush/new flag counties and precincts and the 2003 and 2019 gubernatorial elections. In 2003, Haley Barbour unseated incumbent Democrat governor Ronnie Musgrove. Barbour won by a somewhat comfortable margin considering he was the challenger; the final margin was 53% to 46% in his favor. While NE Mississippi and other rural parts of the state did shift toward Barbour, a big part of his coalition were urban/suburban white voters with a college degree. These voters overwhelmingly supported him over Musgrove.


Hinds with the largest change just as it was with the presidential results. And again, much of this is white flight related, but also can be somewhat attributed to a larger % of white voters in Jackson voting Democratic. Lafayette, Madison, and Oktibbeha all voted for Barbour in 2003 but Hood in 2019. Overall, Hood was a touch above Musgrove in the statewide vote with 47% to 46% for Musgrove. 

Here's the precinct-level results:


Across the board, large improvements for Hood from Musgrove's total. In Jackson's 14th precinct, where Biden saw the largest increase from Gore, Hood ran 44 points ahead of Musgrove. Hood ran 30+ points ahead of Musgrove in much of NE Jackson and 20+ points ahead in slices of Madison, Gluckstadt, Flowood, Hattiesburg, and Oxford. College-educated white voters, which disproportionately backed both Bush and the new flag, were the demographic where Hood saw the most improvement compared to previous Democratic gubernatorial campaigns.

Conclusion

The 2001 flag referendum predicted future coalitions in Mississippi politics. Conservative, rural whites in NE Mississippi (and in places like Hancock and George counties) that stayed loyal to the Democratic Party for decades after the 1960s have almost completely abandoned the party in the last two decades. This is the case at both the presidential level and the statewide level. But at the same time, urban and suburban whites have moved somewhat to the Democrats at the presidential level. And in a competitive gubernatorial election (like the one in 2019), they can shift even harder toward the Democrats. 

The problem for Mississippi Democrats is there are more rural, non-college whites than there are urban/suburban college-educated whites. And the former has moved faster and with larger margins toward the Republicans than the latter has moved toward Democrats. 

While Mississippi isn't likely to vote blue at the presidential level anytime soon, it's not impossible to conceive of Democrats becoming competitive again in a gubernatorial election down the line. If Democrats win, urban/suburban college-educated white voters will be an important part of the coalition. However, given the population distribution of Mississippi (the state is one of the few in the U.S. that is majority-rural), the party will need to win over a decent number of rural whites to get a majority. Given the improvements in urban/suburban Mississippi, they no longer need to win majorities in counties like Tishomingo and George. But they can't afford to lose these areas by 50 and 60 points. This will be the big challenge for the state party in the coming years. Can they hold on to their new bloc of voters while making in-roads with the rural white voters that have ditched them in the 21st century?

Buzzardry notebook 5/17

Berry announcement Scott Berry announced his retirement on Tuesday effective at the end of the year. The news came suddenly but wasn't n...